Charts are nothing but a pictorial representation of data, it is said that charts can express the relationship between data better than the data represented in a tabular format. Obviously, we can read charts more quickly than the raw data. Charts become essential to keep track of the growth of a business, and are very important for analytics purposes. In this article, we will learn to draw a pie chart in the Asp.Net MVC application. Let's get started.
Example: Display the number of students enrolled in each course in a pie chart.
Step 1. create four methods, the first method exposes a list of students, the second method exposes the List of Courses, the third method group joins courses with student and return the grouped result in JSON format, while the fourth method simply returns a view where we will draw the chart.
    public class GoogleChartController : Controller
    {
        //
        // GET: /GoogleChart/

        public List<Student> GetStudent()
        {
            List<Student> studentList = new List<Student>(){
                new Student(){Id=1,Name="Sachin",CourseId=1},
                 new Student(){Id=2,Name="Arjun",CourseId=1},
                  new Student(){Id=3,Name="Vikash",CourseId=1},
                  new Student(){Id=4,Name="Pocha",CourseId=2},
                   new Student(){Id=3,Name="Michaek",CourseId=3},
                  new Student(){Id=4,Name="Jhon",CourseId=4},
                   new Student(){Id=3,Name="Jordan",CourseId=3},
                  new Student(){Id=4,Name="Niraj",CourseId=4},
            };
            return studentList;
        }
        public List<Course> GetCourses()
        {
            List<Course> courseList = new List<Course>(){
                new Course(){Id=1,Name="Java"},
                 new Course(){Id=2,Name="c++"},
                  new Course(){Id=3,Name="C"},
                  new Course(){Id=4,Name="Asp.Net"},
            };
            return courseList;
        }
        public ActionResult GetChartData()
        {
            var res = GetCourses().GroupJoin(GetStudent(), x => x.Id, y => y.CourseId, (c, s) => new
            {
                courseName = c.Name,
                count = s.Count()
            });
            return Json(res, JsonRequestBehavior.AllowGet);
        }

        public ActionResult Index()
        {
            return View();
        }
  }
Step 2. Add the reference of Jquery and Google chart in the head section of view or Layout page.
<script src="~/Scripts/jquery-3.4.1.min.js"></script>
    <script type="text/javascript" src="https://www.gstatic.com/charts/loader.js"></script>
Step 3. Step 3 has 5 sub steps discussed with the help of diagram shown below.
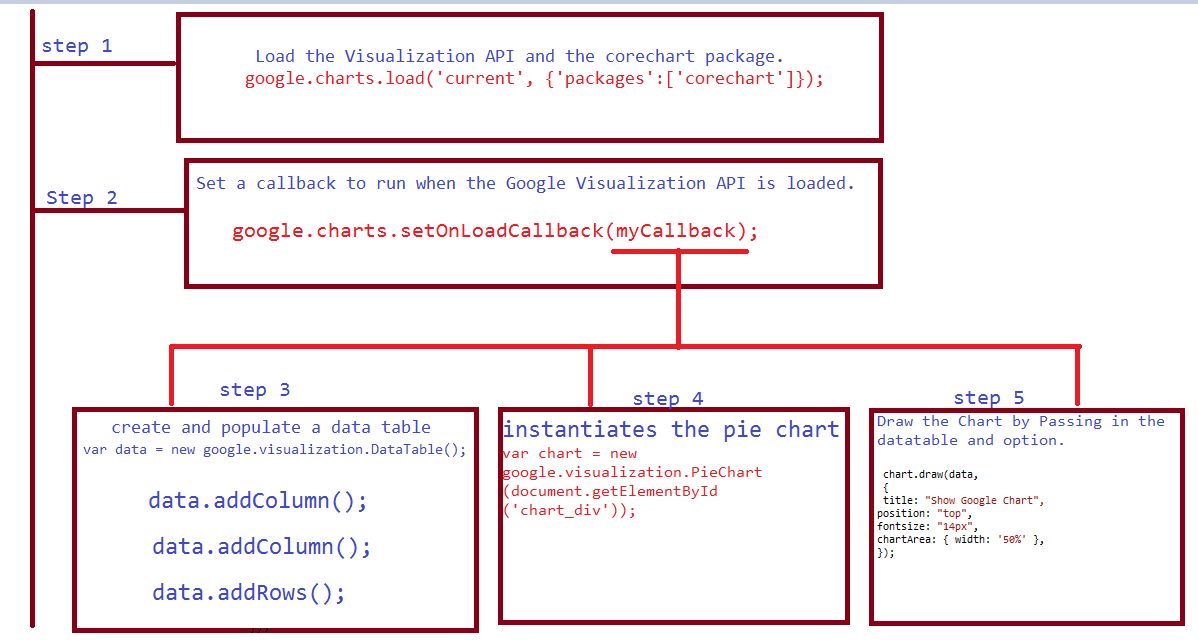
Note:Google chart includes visualization API (Javascript API not web API) , which has all necessary Chart related methods.
 @{
    Layout = null;
  }
<!DOCTYPE html>
<html>
<head>
    <meta name="viewport" content="width=device-width" />
    <script src="~/Scripts/jquery-3.4.1.min.js"></script>
    <script type="text/javascript" src="https://www.gstatic.com/charts/loader.js"></script>

    <!-- jQuery library -->

    <title>Index</title>
</head>
<body>
    <div>
        <!--Div that will hold the pie chart-->
        <div id="chart_div"></div>
        <script type="text/javascript">
            // Load the Visualization API and the corechart package.
            google.charts.load('current', {'packages':['corechart']});

            // Set a callback to run when the Google Visualization API is loaded.
            google.charts.setOnLoadCallback(myCallback);

            // Callback that creates and populates a data table,
            // instantiates the pie chart, passes in the data and
            // draws it.
            function myCallback() {
                $.ajax({
                    type: 'POST',
                    dataType: 'json',
                    contentType: 'application/json',
                    url: '@Url.Action("GetChartData")',
                    data: '{}',
                    success: function (chartsdata) {
                        // Callback that creates and populates a data table,
                        // instantiates the pie chart, passes in the data and
                        // draws it.
                        var data = new google.visualization.DataTable();
                        data.addColumn('string', 'CourseName');
                        data.addColumn('number', 'TotalStudent');
                        $(chartsdata).each(function (x, y) {
                            data.addRow([y.courseName, y.count]);
                        });
                        // Instantiate and draw our chart, passing in some options
                        var chart = new google.visualization.PieChart(document.getElementById('chart_div'));

                        chart.draw(data,
                          {
                              title: "Courses Vs Students",
                              position: "top",
                              fontsize: "14px",
                              chartArea: { width: '70%' },
                          });
                    },
                    error: function () {
                        alert("Error loading data! Please try again.");
                    }
                });
            };
        </script>
    </div>
</body>
</html>
Now run the application, you will find chart is being loaded successfully.
